Reports
Every result can be rendered for a person or a tool, from the CLI (agentlens report,
agentlens compare --json/--html) or from Python (agentlens.report.render). Formats:
| Format | For | How |
|---|---|---|
rich |
an interactive terminal: coloured tables, regressions in red | default of run/compare/report on a TTY |
text |
CI logs, scripts: stable plain text | default when piped, or with NO_COLOR |
json |
tools: the full comparison and gate verdict | --json PATH, report --format json |
markdown |
pull-request comments | report --format markdown, the GitHub Action |
html |
one self-contained page with a trace viewer | compare --html PATH, report --format html |
Terminal
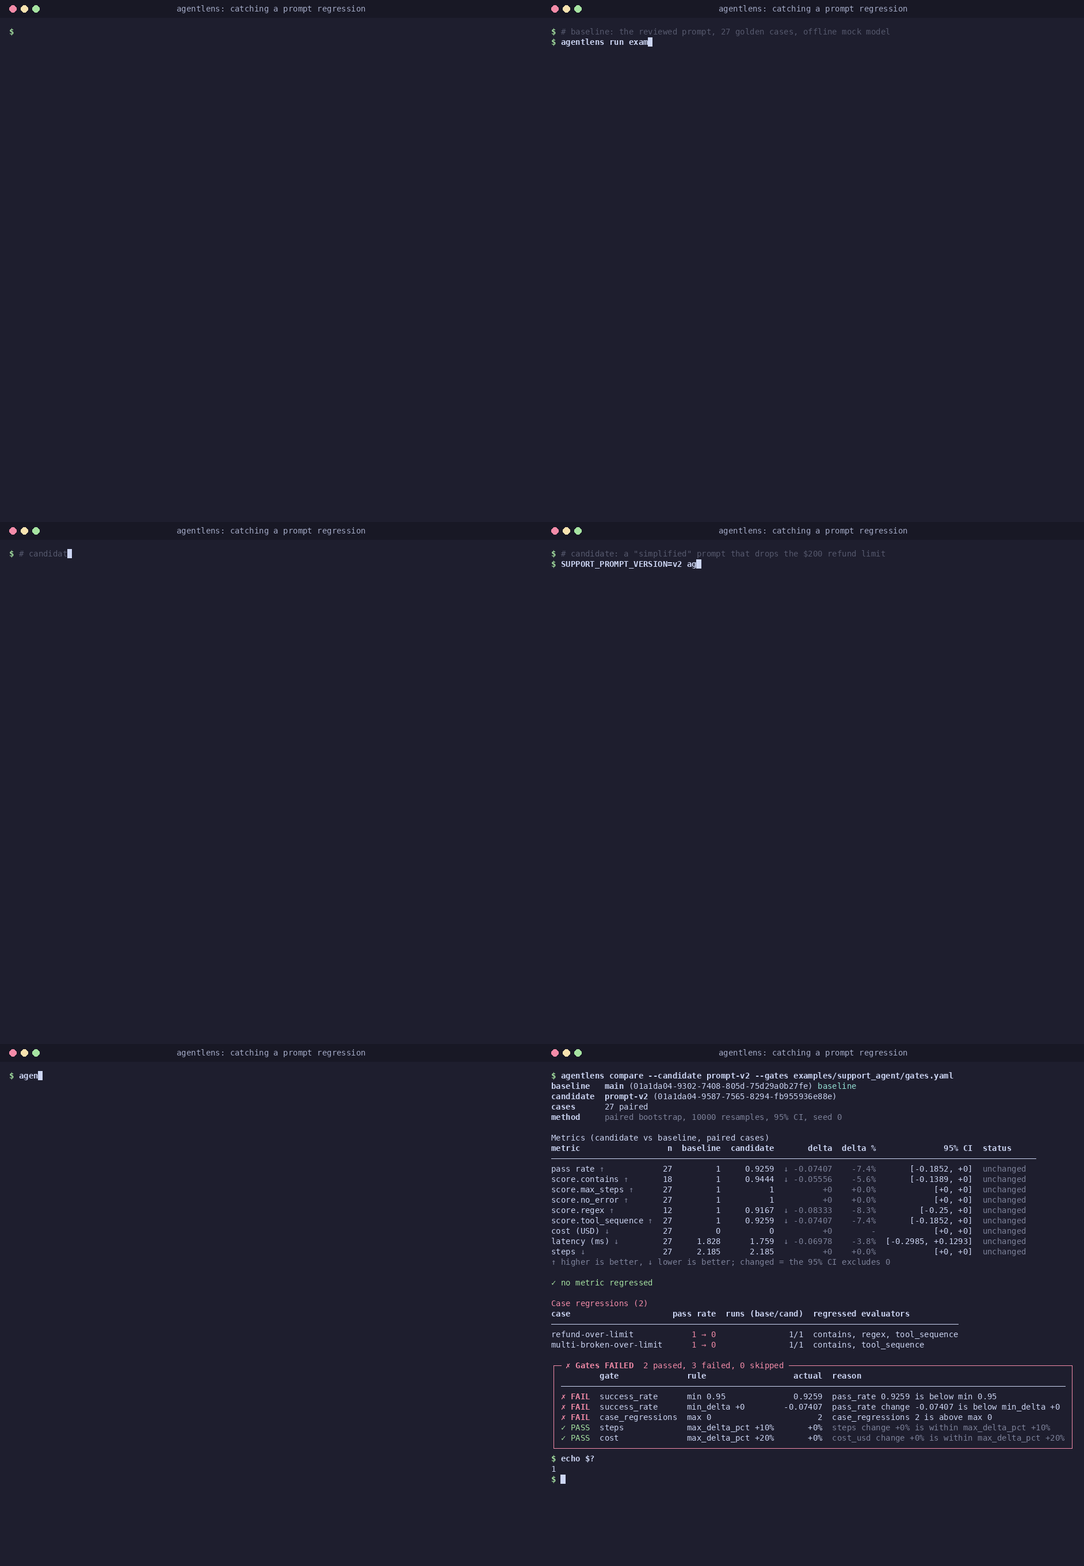
On an interactive terminal run, compare and report print the rich report:
coloured tables where a regressed metric is red and says REGRESSION, an improvement is green,
an unchanged one dim, each delta has an arrow for the way the value moved (↑/↓, coloured by
whether that is good for the metric: lower cost is good, lower pass rate is bad), case regressions
get their own table and gates a pass/fail panel with every reason. Piped, redirected, in CI logs
or with NO_COLOR set they print plain text, which is stable for scripts;
report --format rich|text picks explicitly. From Python, render(report, "rich") returns the
same view with ANSI colours:
from agentlens.compare import compare_runs
from agentlens.report import ComparisonReport, render
from agentlens.suite import Suite, run_suite

cases = [{"id": f"q{i}", "input": f"hello {i}", "expected": f"HELLO {i}"} for i in range(5)]
suite = Suite(name="demo", agent=str.upper, cases=cases, defaults={"evaluators": ["exact_match"]})
comparison = compare_runs(run_suite(suite), run_suite(suite.model_copy(update={"agent": str.lower})))
print(render(ComparisonReport(comparison=comparison), "rich"))   # pass rate ↓ -1 ... REGRESSION
HTML report
agentlens compare ... --html report.html (or agentlens report EXPERIMENT --format html -o
report.html) writes one self-contained HTML file: CSS and JavaScript are inlined and nothing
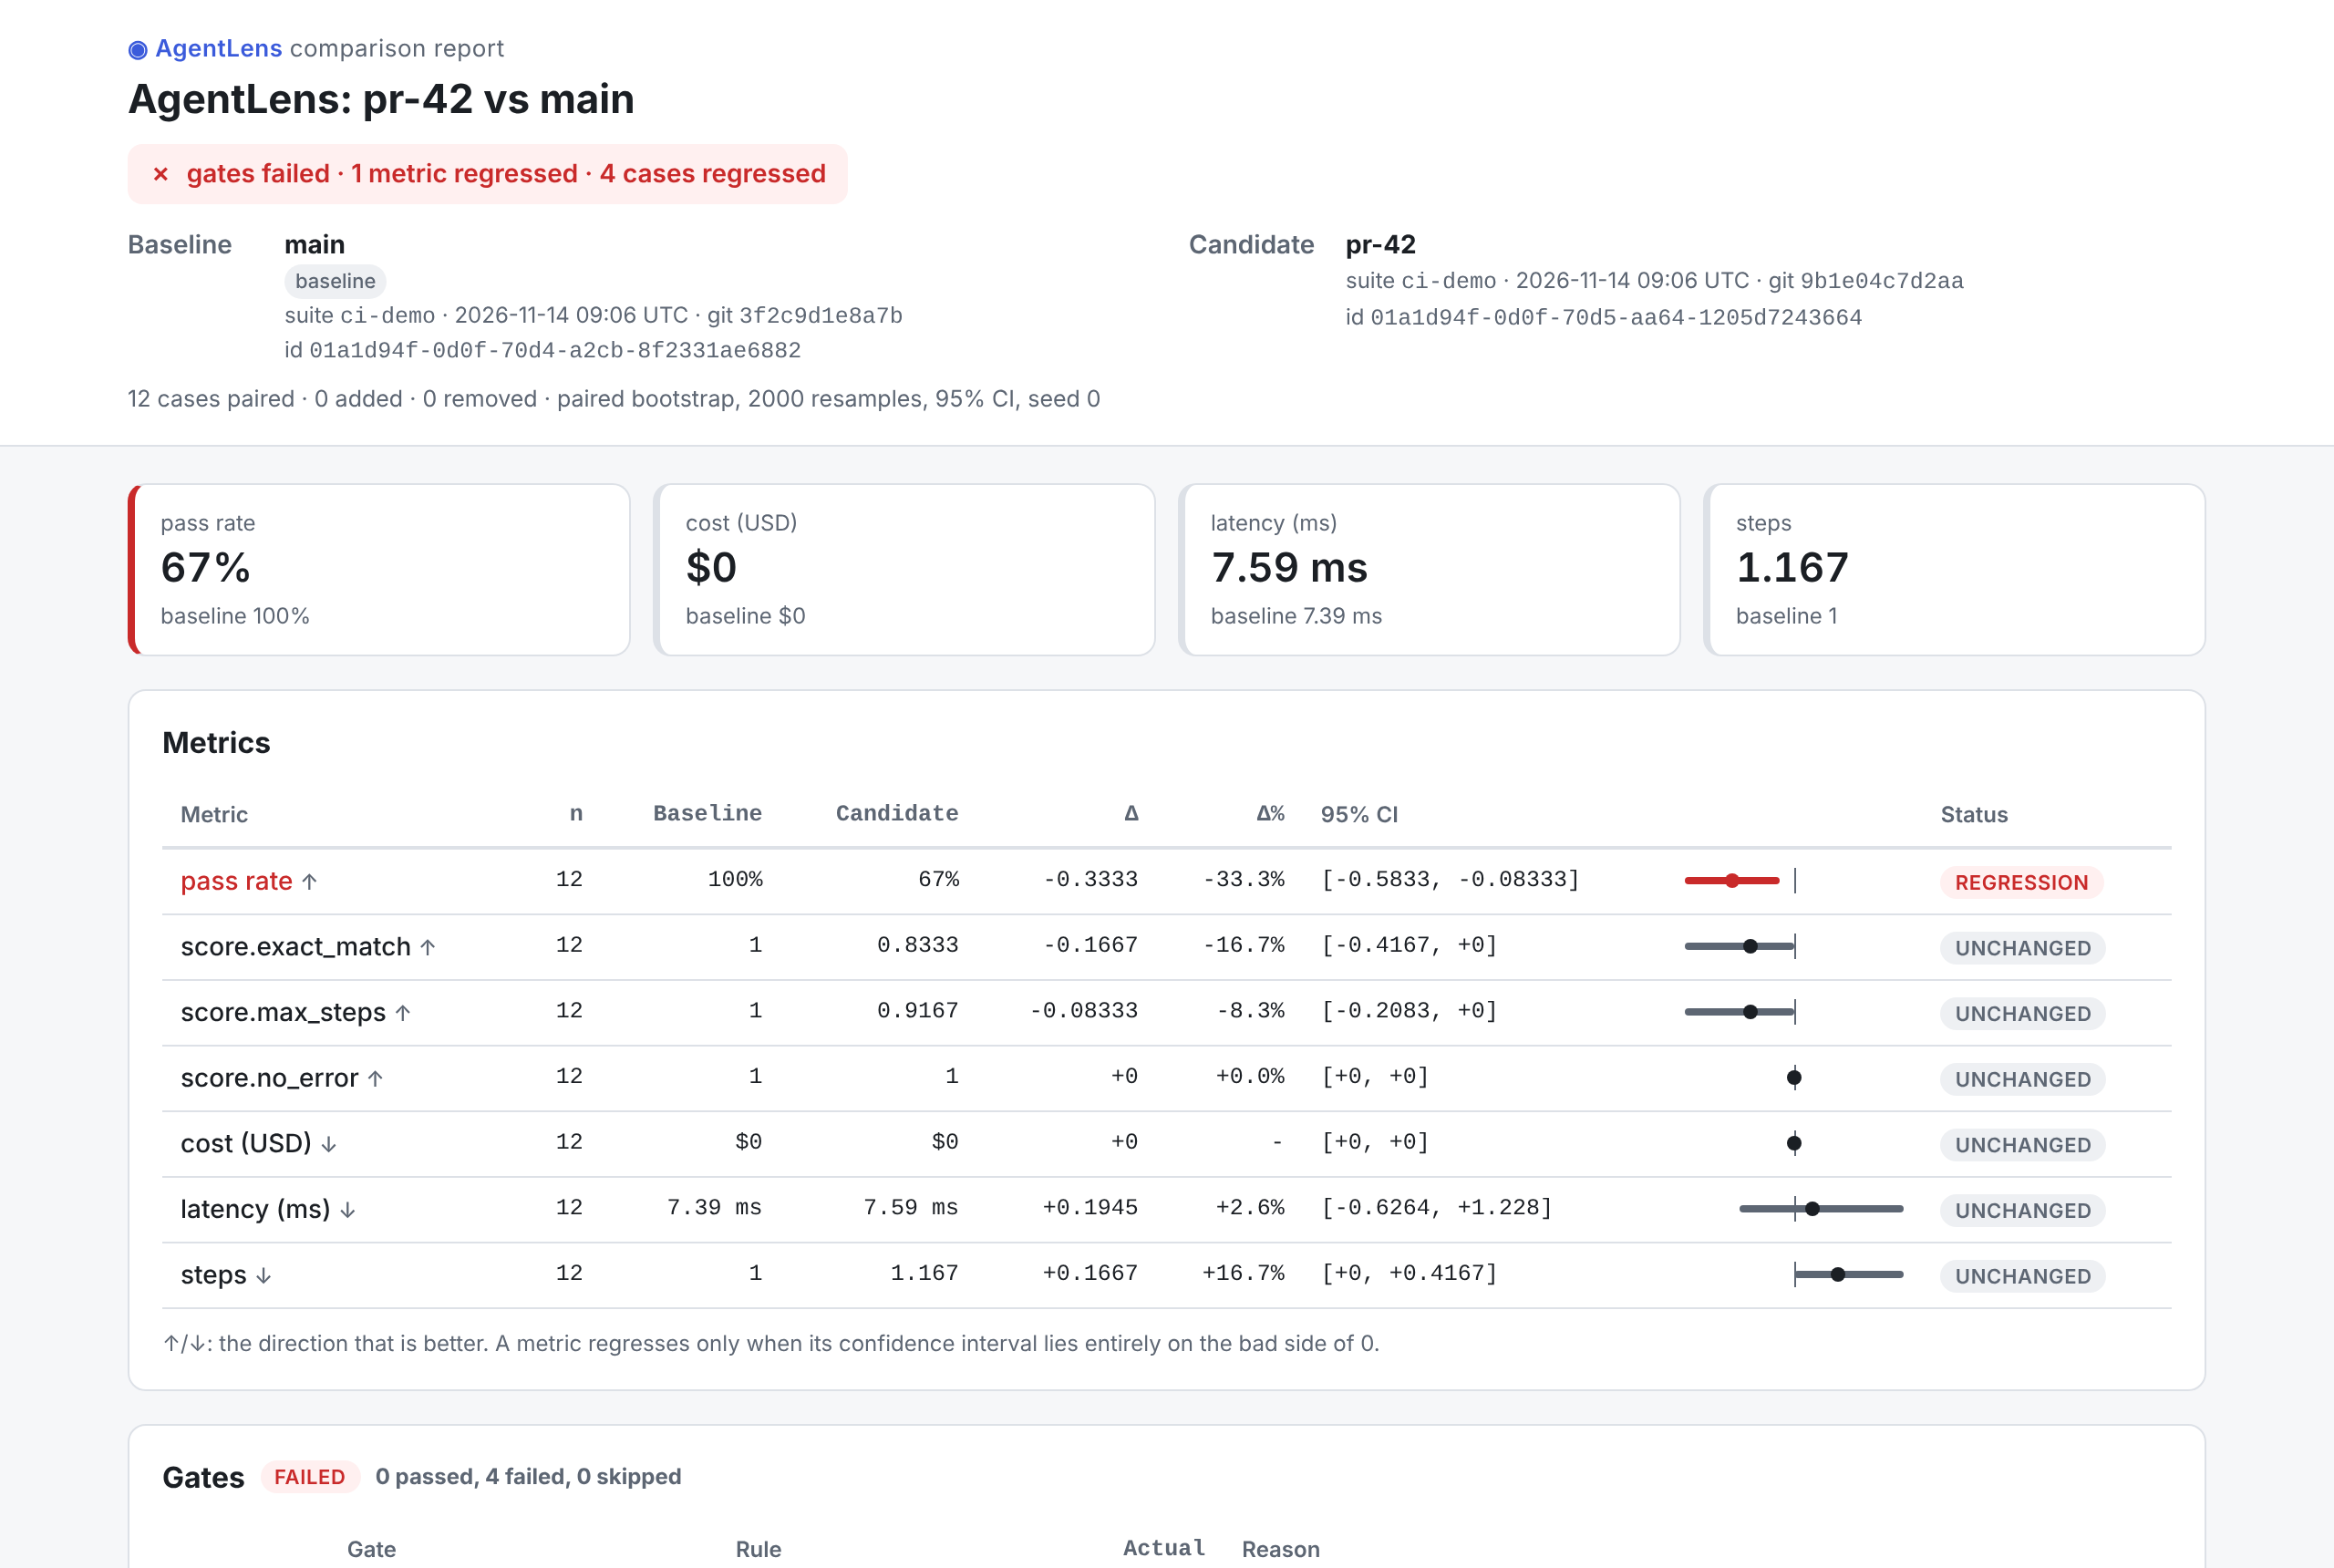
is loaded from the network, so it can be uploaded as a CI artifact or mailed. It has the verdict,
the metrics table with confidence intervals, the gates, and every case with its runs side by
side (baseline vs candidate: pass/fail, each evaluator's score and reason, cost, latency,
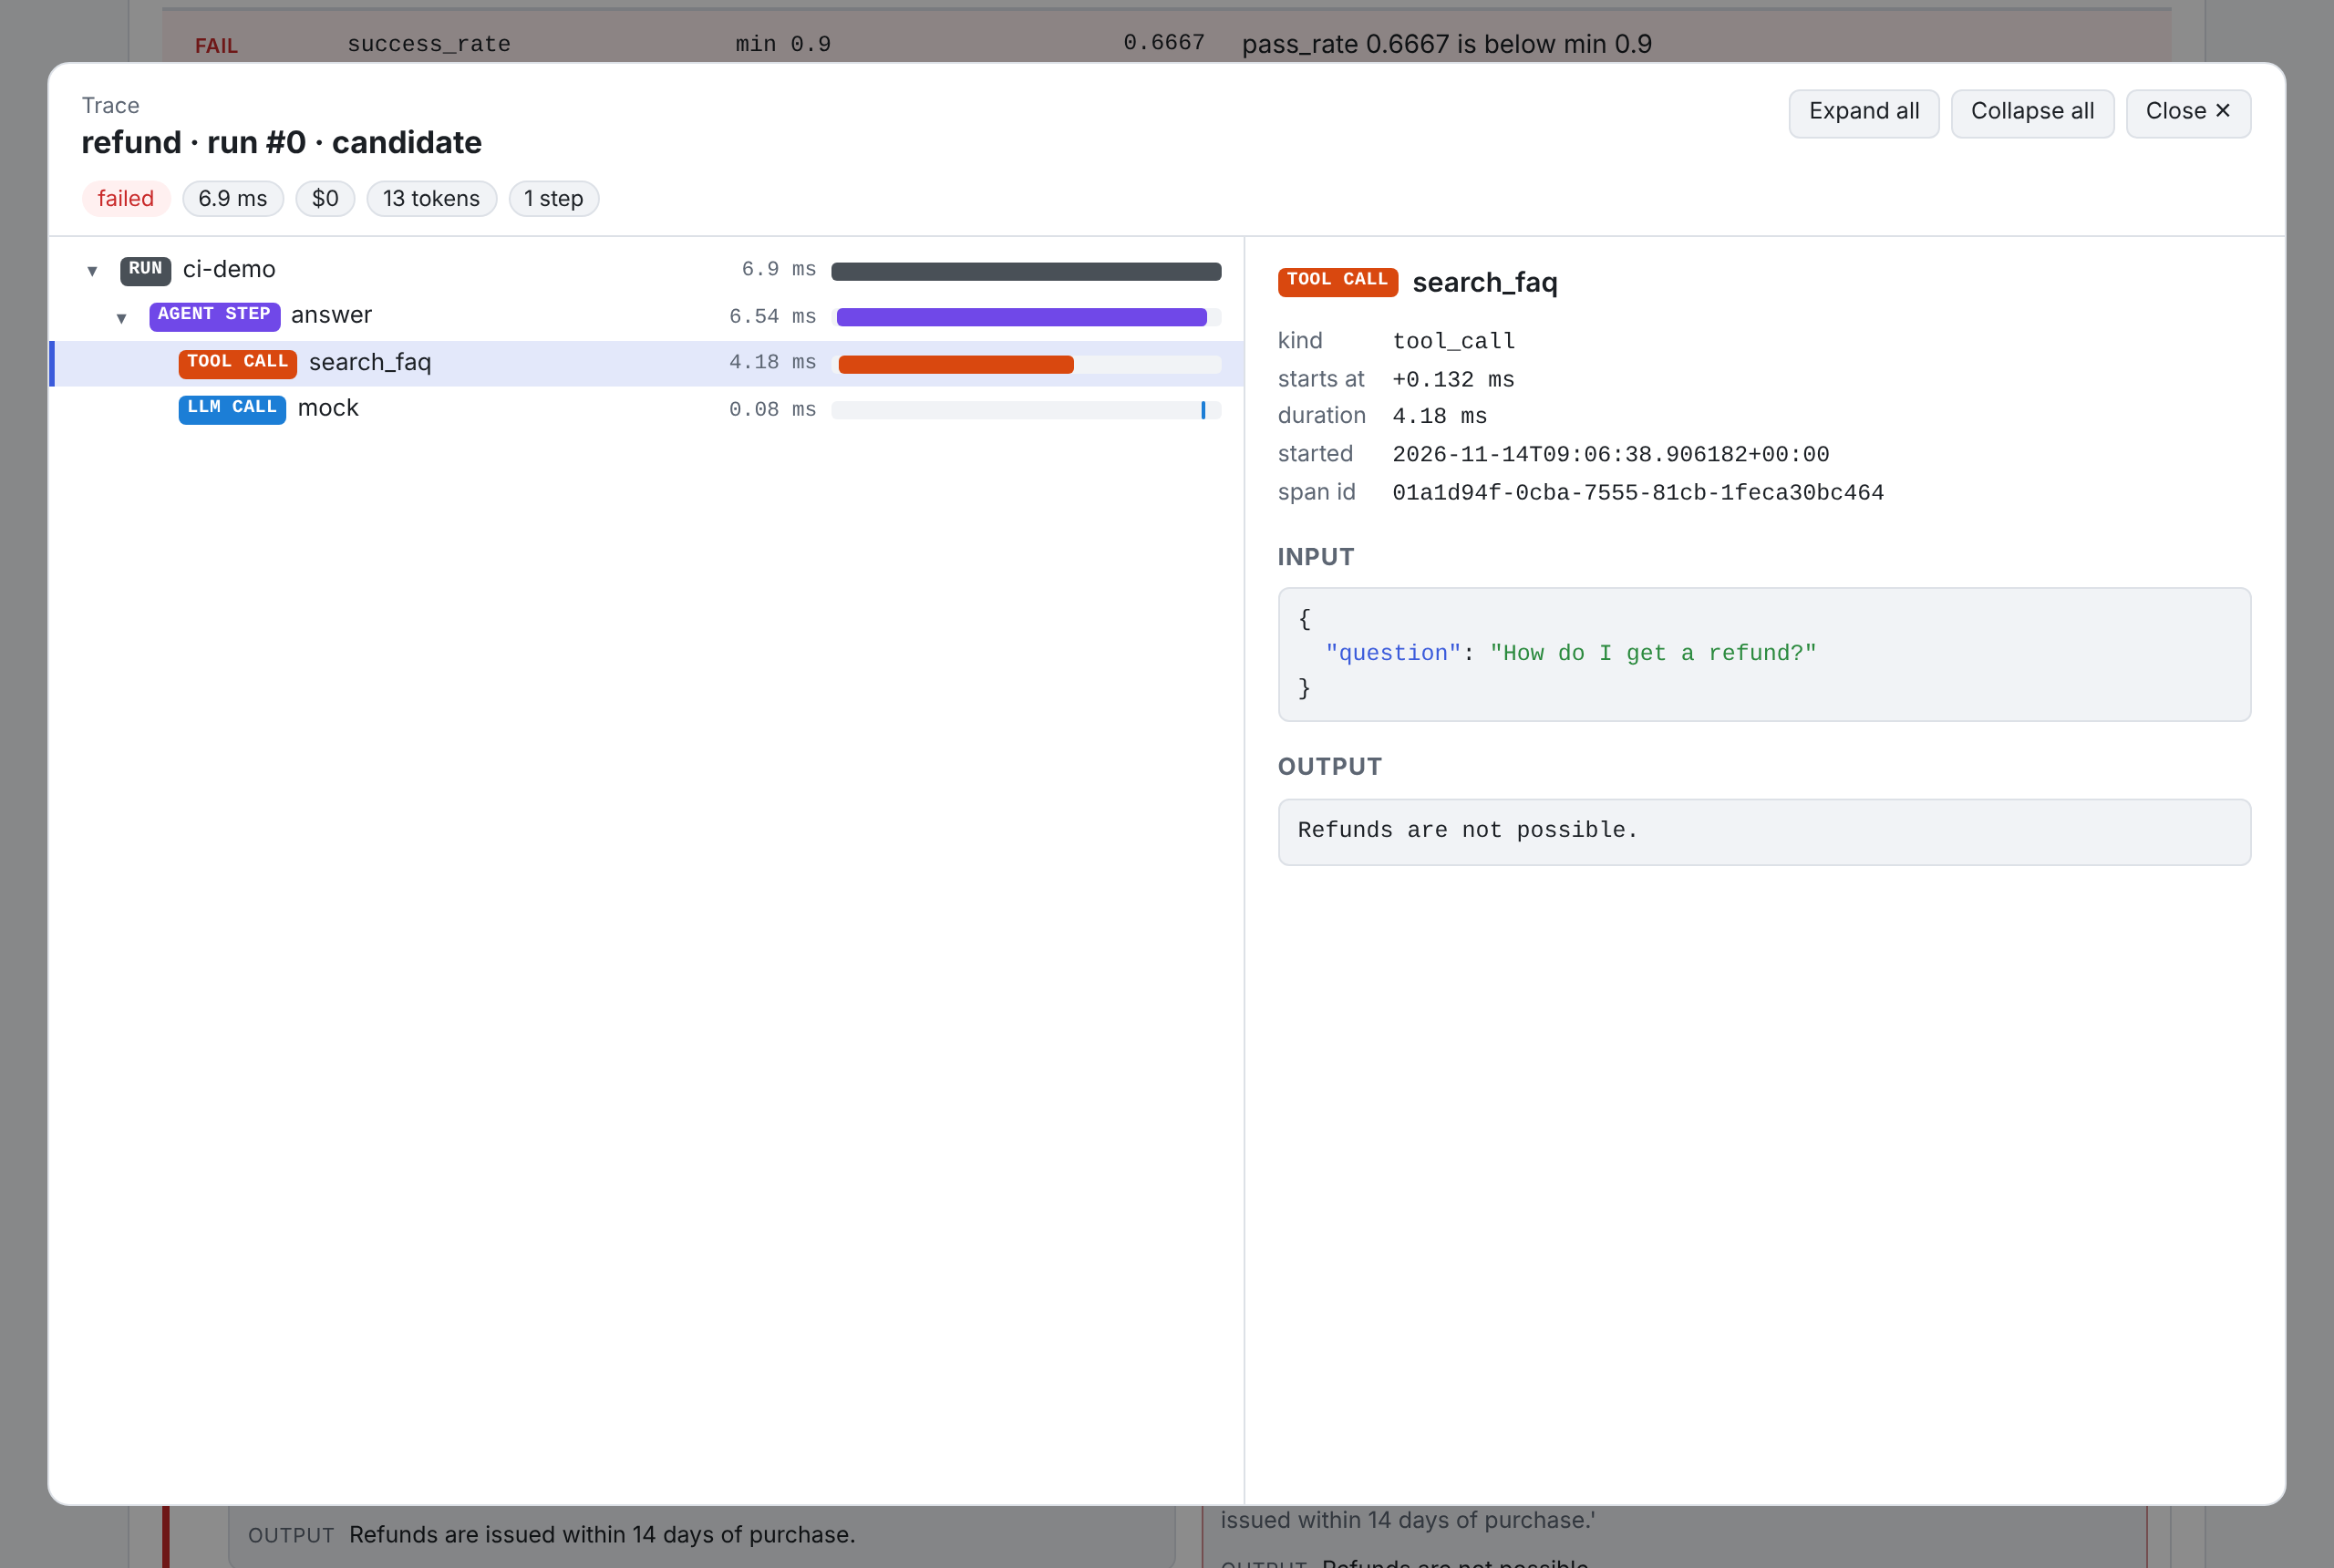
steps); regressions come first and can be filtered. View trace opens the span tree:
collapsible nested spans with kind badges and a timing waterfall, input/output/attributes as
pretty-printed JSON, usage and cost, errors in red. The page follows the system's light/dark
theme, and every value from your data is escaped.
From Python, pass the runs so the traces are embedded:
from agentlens.compare import compare_runs
from agentlens.report import ComparisonReport, render_html
from agentlens.suite import Suite, run_suite

cases = [{"id": f"q{i}", "input": f"hello {i}", "expected": f"HELLO {i}"} for i in range(5)]
suite = Suite(name="demo", agent=str.upper, cases=cases, defaults={"evaluators": ["exact_match"]})
base, cand = run_suite(suite), run_suite(suite.model_copy(update={"agent": str.lower}))
report = ComparisonReport(comparison=compare_runs(base, cand))
html = render_html(report, runs=cand.runs, baseline_runs=base.runs)
open("report.html", "w", encoding="utf-8").write(html)
The screenshots come from scripts/html_report_demo.py (the examples/ci_demo suite run twice,
the second time with a broken answer and an extra step) and scripts/screenshot_html_report.py
(Playwright).
Markdown (PR comments)
agentlens report comparison.json --format markdown renders the GitHub-flavoured report the
GitHub Action posts on pull requests (an example is on that page and in
the regression story); it starts with a hidden
<!-- agentlens-report --> marker so the comment is updated in place.
API: agentlens.report.